(World Mathmatics Year poster produced by the Sociedad Portuguesa de Matematica. Image courtesy of Joe Iwanski, University of Colorado.)
A recurrence plot is a two-dimensional representation technique that
brings out distance correlations in a time series. RPs make it
instantly apparent whether a system is periodic or chaotic. For
example, here's a recurrence plot of a chaotic time series measured
from a parametrically forced pendulum:
The time series -- measurements of the bob angle, in radians, taken every 0.165 milliseconds -- is spread out along both ordinate and abscissa, and pixels are color-coded according to the inter-point distances. For instance, if the 17th point on the trajectory is 1.4 distance units away from the 135th point, the pixel lying at (17, 135) on the recurrence plot will be shaded with the color that corresponds to the distance range that includes 1.4 (yellow-green, in the plot above). This particular plot was constructed using the euclidean norm, but other norms work just as well.
This intricate, beautiful structure reflects how trajectories move on a chaotic attractor, making close (and not-so-close) returns on different time scales.
Periodic time series have equally characteristic RPs. Below is an RP of a time series gathered from the same pendulum, but at a higher forcing frequency, where the dynamics converged to a limit cycle:
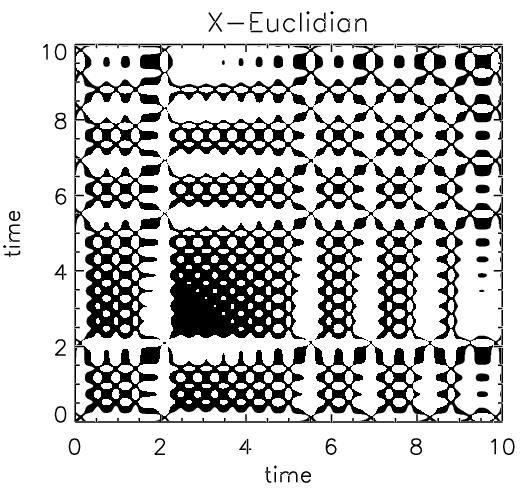
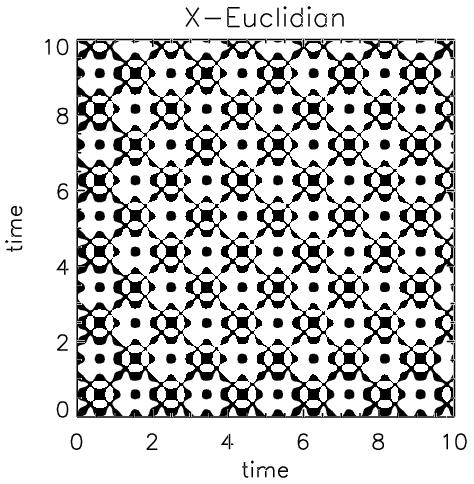
One can also plot thresholded recurrence plots or TRPs, which highlight points that fall within a specified distance of one another. In a TRP, the pixels located at (i,j) and (j,i) plot are black if the distance between the ith and jth points in the time series falls within some threshold corridor, like [0, 0.1], and white otherwise.
We are interested in recurrence plots because they are an effective way to visualize the geometry of a dynamical system's behavior, and we are working on analysis techniques that can effectively characterize the geometry of their structure. Our goal is to find a good set of building blocks with which to characterize recurrence-plot geometry. One important application of this kind of work is classification of dynamical systems. When one is trying to determine whether a particular ordinary differential equation matches the behavior of a system, or whether two different dynamical systems are similar, it is important to be able to compare the two effectively. The standard technique for doing this, nonlinear regression, is both expensive and subject to convergence problems because of local extrema in the regression landscape. Because they give a broad-brush view of the geometry of a system's behavior, recurrence plots may be a better way to do a quick comparison of two dynamical systems.
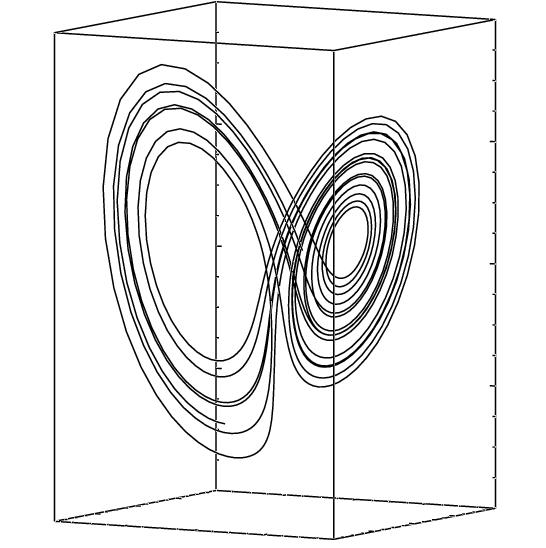
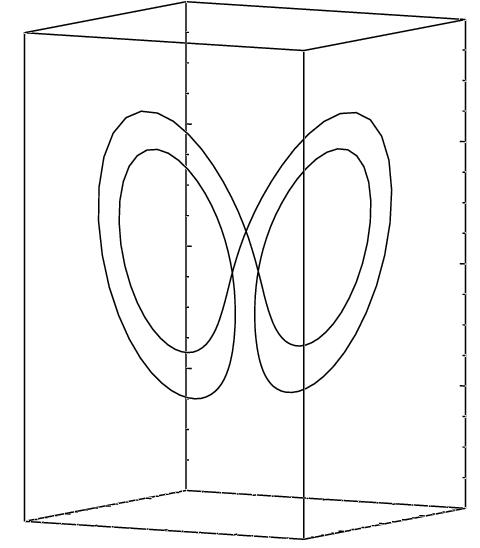
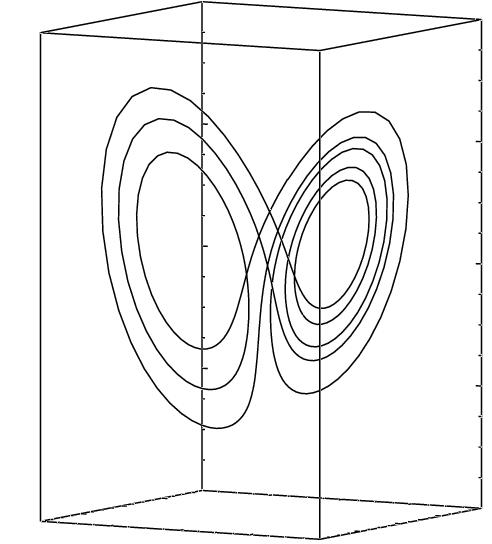
One way to understand the geometric structure of a recurrence plot is to consider the unstable periodic orbits or UPOs that lie within a chaotic attractor. There are an infinite number of UPOs, of all periods, densely embedded in such an attractor; indeed, the orbit is the closure of the set of UPOs and the trajectory can be thought of as "hopping" from one UPO to the next. The figure below demonstrates this. The left-hand image is an arbitrary Lorenz system trajectory; the two right-hand images show trajectories from initial conditions that are balanced perfectly on (respectively) a two-cycle and a five cycle:
 |
 |
 |
On a recurrence plot, UPOs manifest in a visually obvious way. The images below show TRPs of the x components of the above trajectories:
 |
 |
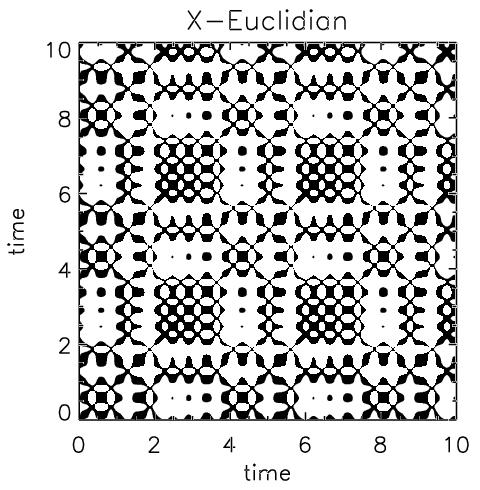 |
This decomposition led us to conjecture that the unstable periodic orbits embedded in a chaotic attractor are a useful basis set for the geometry of a recurrence plot of those data. This provides not only a simple way to locate unstable periodic orbits in chaotic time-series data, but also a potentially useful way to use a recurrence plot to identify a dynamical system. The Bradley/Mantilla paper listed below explains these ideas in more detail.
Another interesting result of this line of work has been the conjecture that recurrence plots are, to at least some extent, independent of embedding dimension if the system is of low dimension and one uses the maximum norm. See the Iwanski/Bradley paper below for more details.
Papers:
