Information-theoretic analysis of ice-core data
Project Description:
We take an information-theoretic approach to analyzing 68,000 years of
water isotope data from the WAIS Divide ice core, the longest,
highest-resolution record yet recovered from Antarctica. The water
isotopes are primarily a proxy for local temperature at the time of
snow deposition, but also contain information about broader
atmospheric circulation patterns. Using estimates of the Shannon
entropy rate of the isotope measurements, we find that the rate of
information production reveals differences in analytical techniques,
even when those differences leave no visible traces in the raw
data. The entropy calculations also allow us to identify a number of
intervals in the data that may be of direct relevance to paleoclimate
interpretation.
Here are a few of those results:
 |
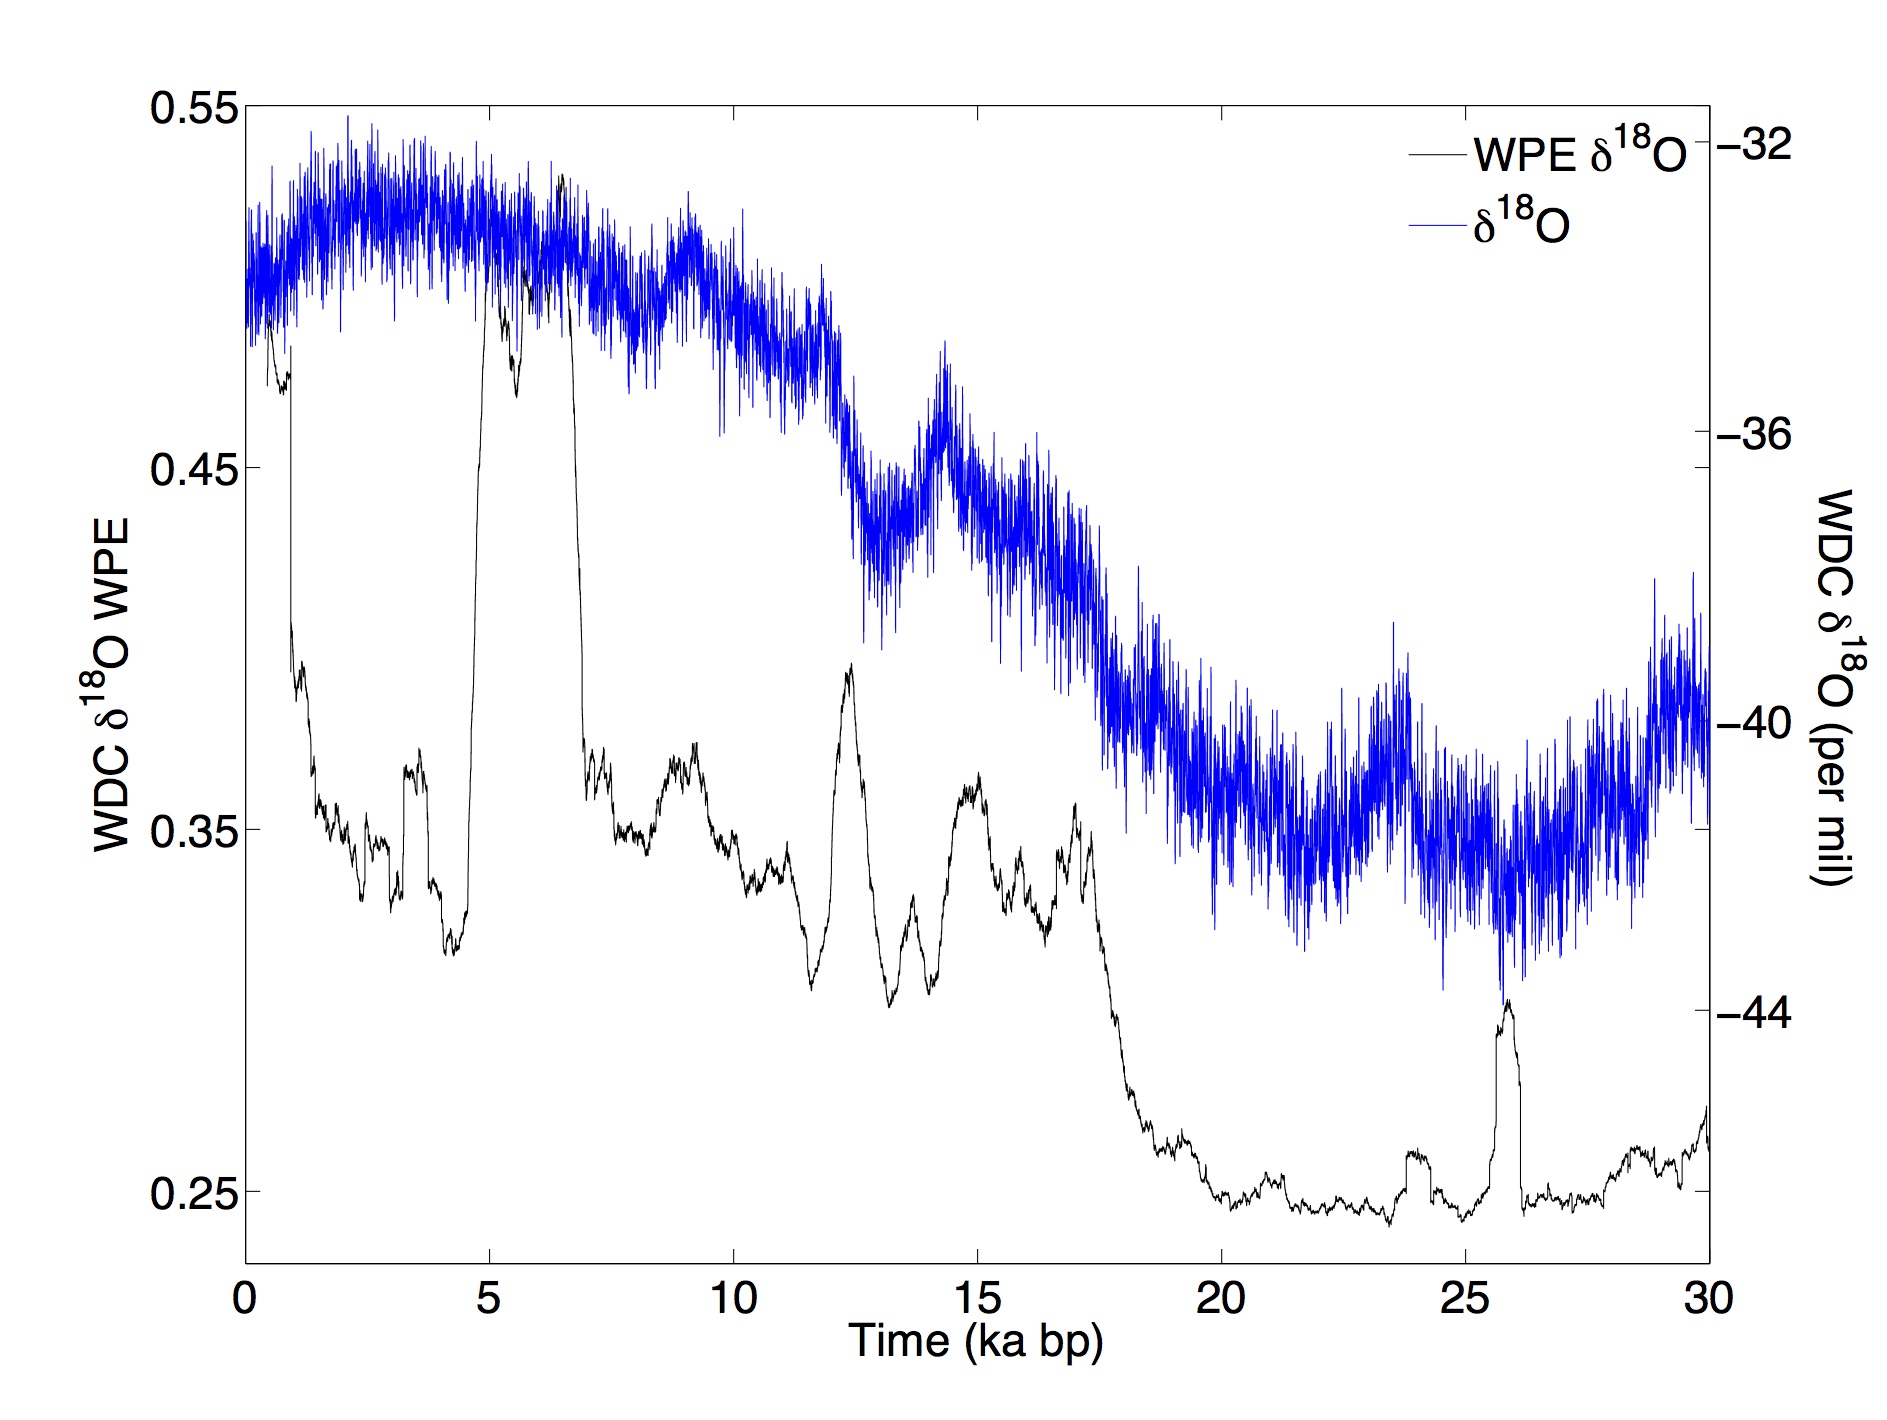 |
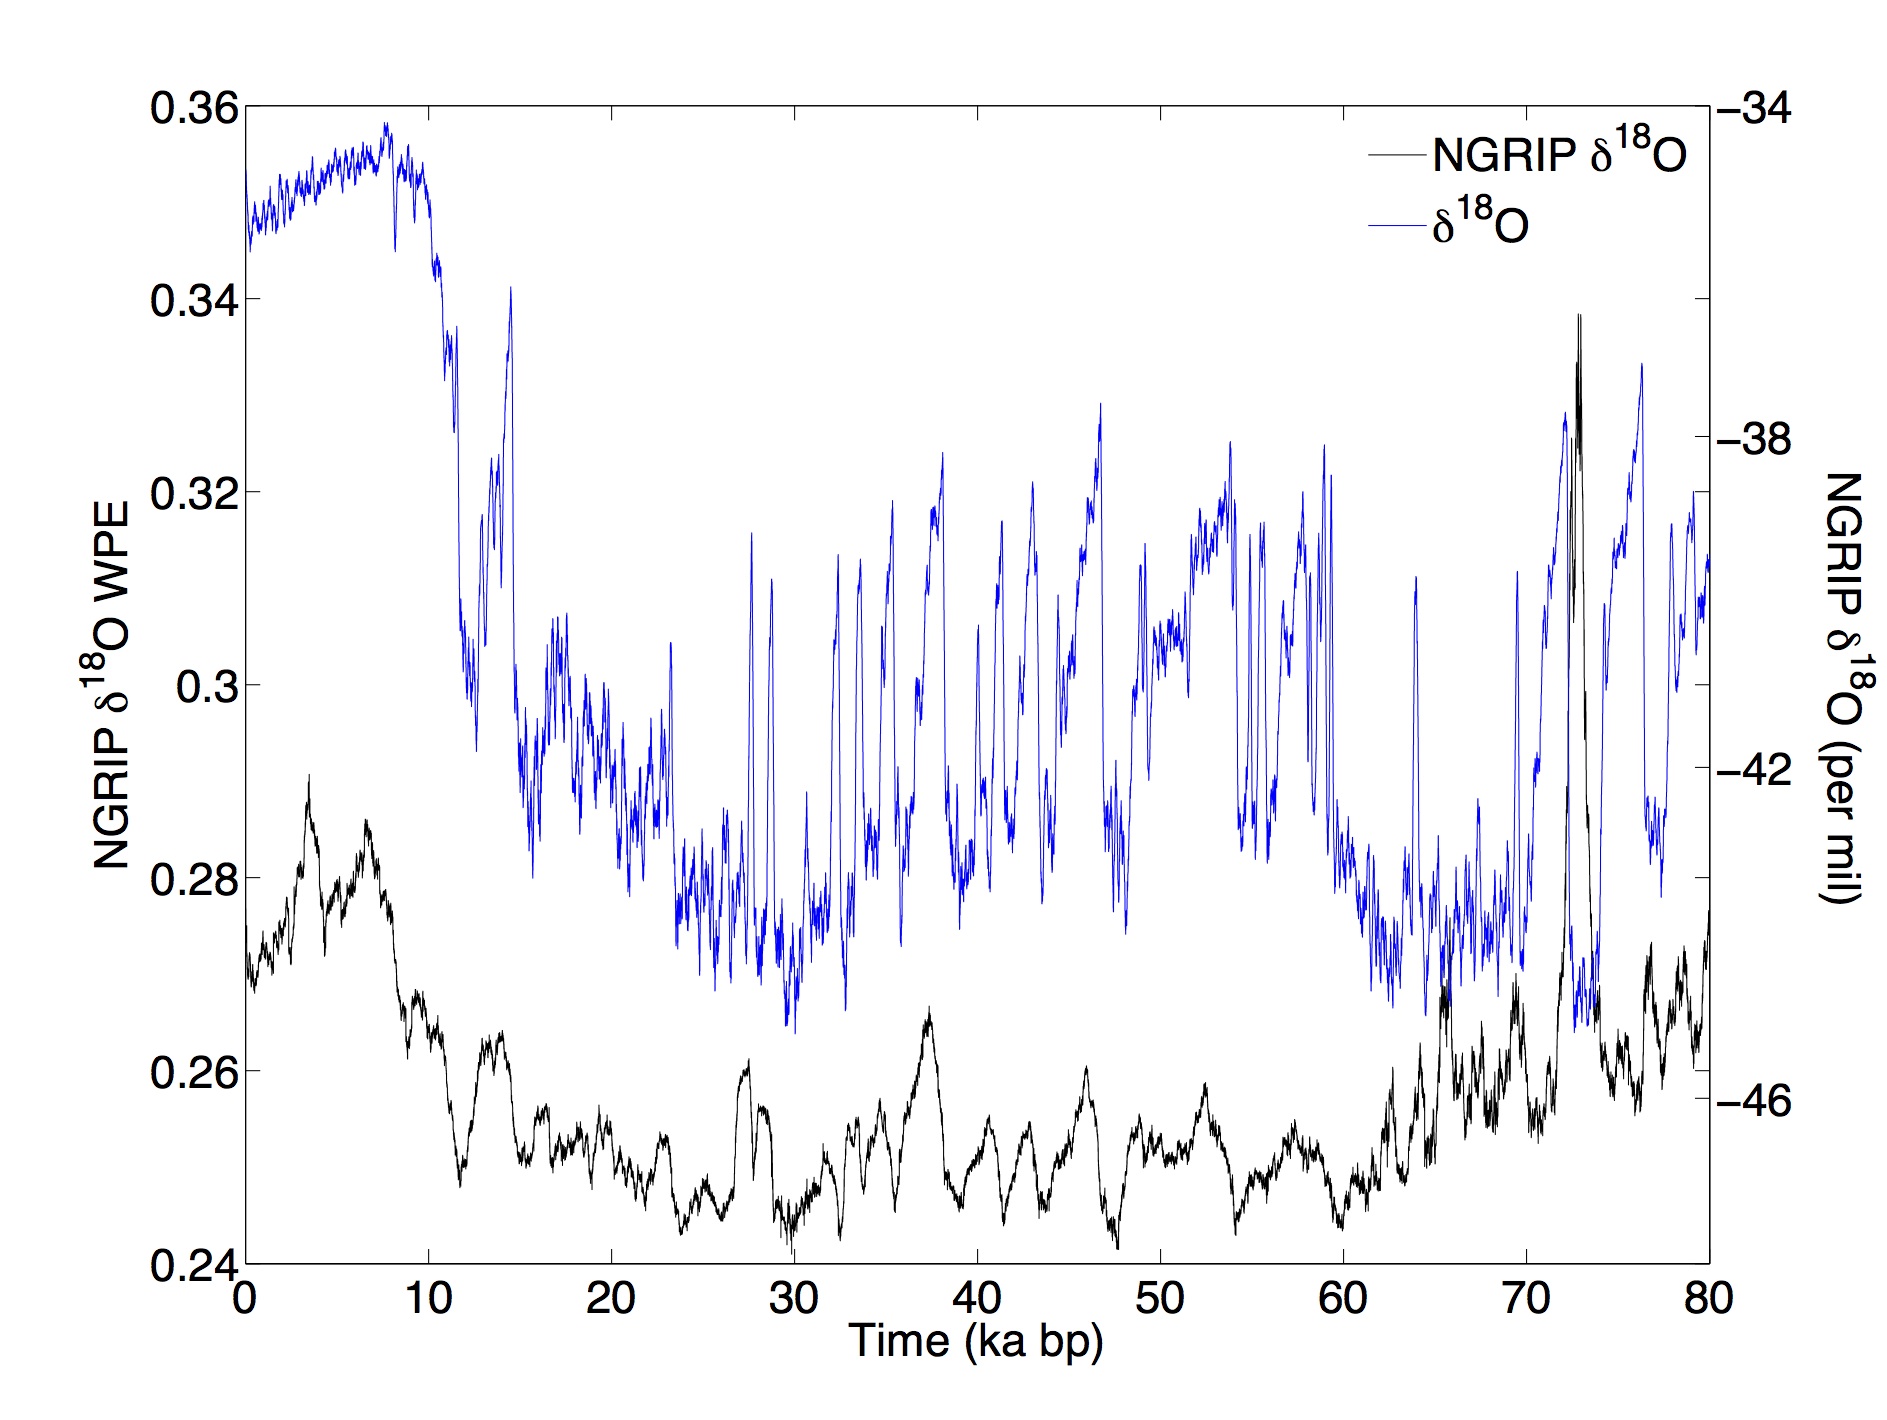
The blue traces in these images are the d18O measurements from the
NGRIP (left) and WAIS Divide (right) cores; the black traces are estimates of the
Shannon entropy rate calculated from those signals using a weighted
variant of permutation entropy (WPE) technique described by
Fadlallah et al.. WPE measures the average rate at which new
information-unrelated to anything in the past-is produced by the
system that generated the time series. If that rate is very low, the
current observation contains a lot of information about the past and
the signal is perfectly predictable. If that rate is very high, all
of the information in the observation is completely new: i.e., the
past tells you nothing about the future. The 2016 Intelligent Data
Analysis Symposium paper and 2019 Chaos paper cited
below describe these ideas and results in more depth. You can also
check
out this
press release from the Santa Fe Institute for a higher-level
overview of the project.
A very interesting feature in the right-hand curve above is the
large jump in WPE between 5-8 ka. As it turns out, an older
instrument was used to analyze the ice in this region. The WPE
results suggest that that instrument introduced noise into the data:
i.e., every measurement contains completely new information, unrelated
to the previous ones. That noise is not easy to see in the d18O data
itself without a laborious, fine-grained examination by a human
expert, but the anomaly is easily flagged with a quick calculation of
WPE. By going back and re-measuring this segment of the ice, we were
able to confirm the conjecture that the jump in WPE was due to noise
in the older instrument; please see the 2018
Entropy paper cited below for more details or this
press release from the Santa Fe Institute for more details.
It also turns out that WPE tracks accumulation, which is a very
useful result, as described in 2019 the CHAOS paper below.
We have recently discovered that permutation entropy techniques
can also detect mixing effects in a data set - e.g., when successive
measurements are not independent - and even estimate the scales on
which this occurs. This can happen in the laboratory apparatus (e.g.,
if measurements are performed in a chamber or a pipe) or in the study
system (e.g., diffusion in the ice sheet). We are also studying this
effect in methane data from Mauna Loa and ocean sediment cores. See
the Neuder et al. paper in the list below for more details.
People:
Papers, press, talks:
- M. Neuder, E. Bradley, E. Dlugokencky, J. W. C. White, and
J. Garland,
"Detection of Local Mixing in Time-Series Data Using Permutation
Entropy," in revision,
Physical Review E. Preprint available
on arXiv.
- J. Garland, T. R. Jones, M. Neuder,
J. W. C. White, and E.
Bradley,
"Climate entropy production recorded in a deep Antarctic ice core,"
CHAOS 29 101105 (2019). Preprint available
on arXiv.
- Presentation at
the
2019 SIAM GeoScience Meeting
- J. Garland, T. R. Jones, V. Morris, M. Neuder, J. W. C. White,
E. Bradley,
"Anomaly
Detection in Paleoclimate Records using Information
Theory," Entropy 20:931 (2018)
- J. Garland and
E. Bradley, "Information
Theory in Earth and Space Science," SIAM News, October 2018
- J. Garland, T. Jones, E. Bradley, R. James and
J. W. C. White, "A First Step
Toward Quantifying the Climate's Information Production Over the Last
68,000 Years,"
IDA-16
(Proceedings of the 12th International Symposium on Intelligent Data
Analysis), Stockholm, October 2016.
- Poster presentation at
the
2016 AGU Fall Meeting
- Press releases from the Santa Fe
Institute
about the
overall project and
the
anomaly detection specifics.
Support:
- This material is based upon work supported by the National
Science Foundation under grant number 1807478, among others. Any
opinions, findings, and conclusions or recommendations expressed in
this material are those of the author(s) and do not necessarily
reflect the views of the National Science Foundation.