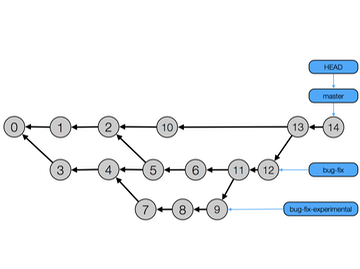
This homework assignment asks you to demonstrate your skills with Git by creating a git repo with the commit graph below.
Click on image to see a larger version
Note: this link takes you to the 2015 version of this website!
Be sure to click the Back button to return to this page.
I want to ensure that each student has taken the time to practice the skills covered in Lecture 3. Creating a repo, editing files, adding them to the index, creating commits, and resolving merge conflicts is much different than watching me do it!
It should go without saying that you should review the material in Lecture 3 (Git) before working on the problem below.
Format for Homework 2
IMPORTANT: You will submit Homework 2 in the same fashion as Homework 1. You will upload your finished repo to GitHub and add my GitHub id (kenbod) as a collaborator.
Collaboration
Note: I strongly encourage students to work in teams on these assignments.
Assignment Header
IMPORTANT: I had students submit assignments for Homework 1 that did not contain a header at the top of the page with information that identified the assignment or the student who submitted it! For this assignment, make sure that the top of your README.md file (within the git repo) contains (at the very least):
- A line that identifies the class and current semester (i.e.
CSCI 5828 – Spring 2016) - A line that identifies the homework assignment (i.e.
Homework 2) - A line that identifies the people who worked on the assignment (list all team members)
- Other embellishments (such as the due date) are fine too
This requirement holds true for all subsequent assignments in this class and is a good practice to follow for all of your other classes as well!
Instructions
Create a git repo that produces the commit graph above. This is similar to the example in Lecture 3 and will help you demonstrate your knowledge of creating git repos, making new commits, creating branches, and merging branches.
The content in the repo should be kept to a minimum, along the lines of what I did for the Lecture 3 example. In this case, you will create a README.md file and include an image as well.
Other than creating the graph above, the other requirements are:
- that at least one of your merges should generate a merge conflict that you have to resolve and,
- the very last commit on the master branch must have an image file that displays the commit graph prior to the last commit. That is, the image will contain all commits up to commit 13, but not commit 14. You will then add the image to the repo as part of creating commit 14.
- the very last commit on the master branch must also have a README.md file that contains a list of all the git commands you used to create the entire repo starting with the
command and ending with thegit init
commands that were used to check in the final change of README.md on the master branchgit add <image_file> README.md; git commit
Since you have 15 commits to create, I would highly recommend having your commit messages reference the commit you are creating. That is, your first commit message should include a reference to Commit 0 while your fourth commit message will have a reference to Commit 3 and so on. This will allow you to keep track of what commits you have created and what you need to do next!
When working on this problem myself, I found it helpful:
- to number my commands in the README.md file and to build up the list of commands incrementally as I created the commits. (Things get confusing when dealing with the multiple branches but having numbered commands helps with that.)
- to add lines like
[EDIT README.md]to my list of commands to indicate when in the command history I edited a file - and to add indications of what branch I was on when I issued a command
- Note: when you add commands to the README.md file, you will need to add a <br> tag at the end of each one, so they display properly when converted to HTML.
As you are working with your repo, you can run the command
to see the graph that is being created. You can also use other git graph visualization tools, simiar to GitUp, to keep track of the commit graph that you are creating. (Note: GitHub has the ability to display the commit graph. If you use it to generate your image by taking a screenshot, do not include the commands you used to upload the repo to GitHub in your README.md file.)git log --graph
Once you have your repository in the final state, you should then upload it to GitHub (using the instructions I covered in class for uploading an existing repository to GitHub) and add me as a collaborator.
IMPORTANT: When uploading the repository to GitHub, you need to make sure that you upload all three branches. To do that, perform the following steps:
- Create an empty repo on GitHub (see Lecture 4)
- git checkout master
- git remote add origin <GitHub URL> (see Lecture 4, Slide 29 for an example)
- git push -u origin master
- git checkout bug-fix
- git push -u origin bug-fix
- git checkout bug-fix-experimental
- git push -u origin bug-fix-experimental
- git checkout master
Due Date
You must add me as a collaborator to your repo for Homework 2 by the start of Lecture 9. That lecture starts at 12:30 PM MDT on September 20, 2016.